
Software engineering metrics provide trackable data for progress, improvements, and better decision-making to make the entire software development lifecycle more predictable and measurable.
StackSpot’s motto is precise: “The developer platform that turns your context into efficiency“, which could also be a platform being data-driven oriented.
In this blog post, we’ll share how the StackSpot Runtime Engine team used StackSpot AI to create its first dashboard, gathering relevant data relative to deployments.
Observation: Some values were hidden in the article to protect sensitive data.
Objectives and Key Results
The StackSpot Runtime Engine team is responsible for deploying applications and creating infrastructure resources while maintaining customized settings for each user inside the whole StackSpot context.
We needed to identify which metrics were relevant in the platform context to define this team’s OKR (Objectives and Key Results) as measurable goals.
As we discussed a SaaS platform module specialized in CI/CD operations using IaC (Infrastructure As Code) through Terraform, one of the first relevant data was the number of deployments performed using the engine.
Some pertinent other metrics were:
- The engine efficiency (runs success rate)
- The average deployment duration (in seconds)
- The average amount of tentatives to successfully deploy an application
Context
StackSpot Engineering Team created an EventBus API to facilitate asynchronous and decoupled communication between our various application components.
The StackSpot Runtime Engine domain evolved a lot through 2023, and so did the EventBus API and the Data Platform, as all domains went through different phases (some with legacy code still running) to give support to all StackSpot concepts and mechanisms.
Therefore, the Runtime Engine team’s challenge was gathering metrics from different data models and consulting them from various sources due to the Event Bus and the Data Platform versioning.
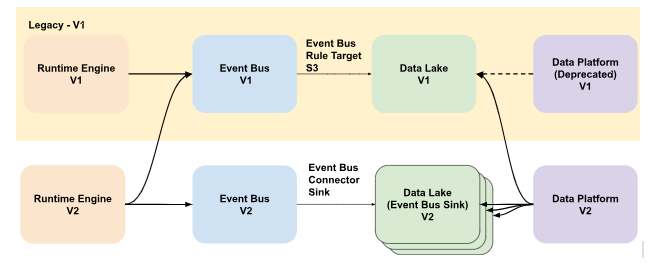
The runtime data model looks like this for the Runtime Engine V1 events:
{
  "id": "VALUE",
  "domain": "runtime",
  "source": "/runtime-engine-api",
  "specversion": "1.0",
  "time": "TIMESTAMP",
  "type": "runtime-engine-api.event-x.v1",
  "data": {
    "FIELD1": "VALUE",
    "FIELD2": "VALUE",
    "FIELD3": "VALUE"
  }
And like this for the Runtime Engine V2 events
{
  "id": "VALUE",
  "domain": "runtime",
  "source": "/runtime-engine-api",
  "specversion": "2.0",
  "time": "TIMESTAMP",
  "type": "runtime-engine-api.event-x.v2",
  "data": {
    "FIELD4": "VALUE",
    "FIELD5": "VALUE",
    "FIELD6": "VALUE"
  }
}
Moreover, there were two different databases to search for those data. Let’s call them:
- OldDatabase
- NewDatabase
In summary, SQL queries for the Runtime Engine dashboard are needed to get data from different sources and gather different data models into one specific metric.
Solution: StackSpot AI in action!
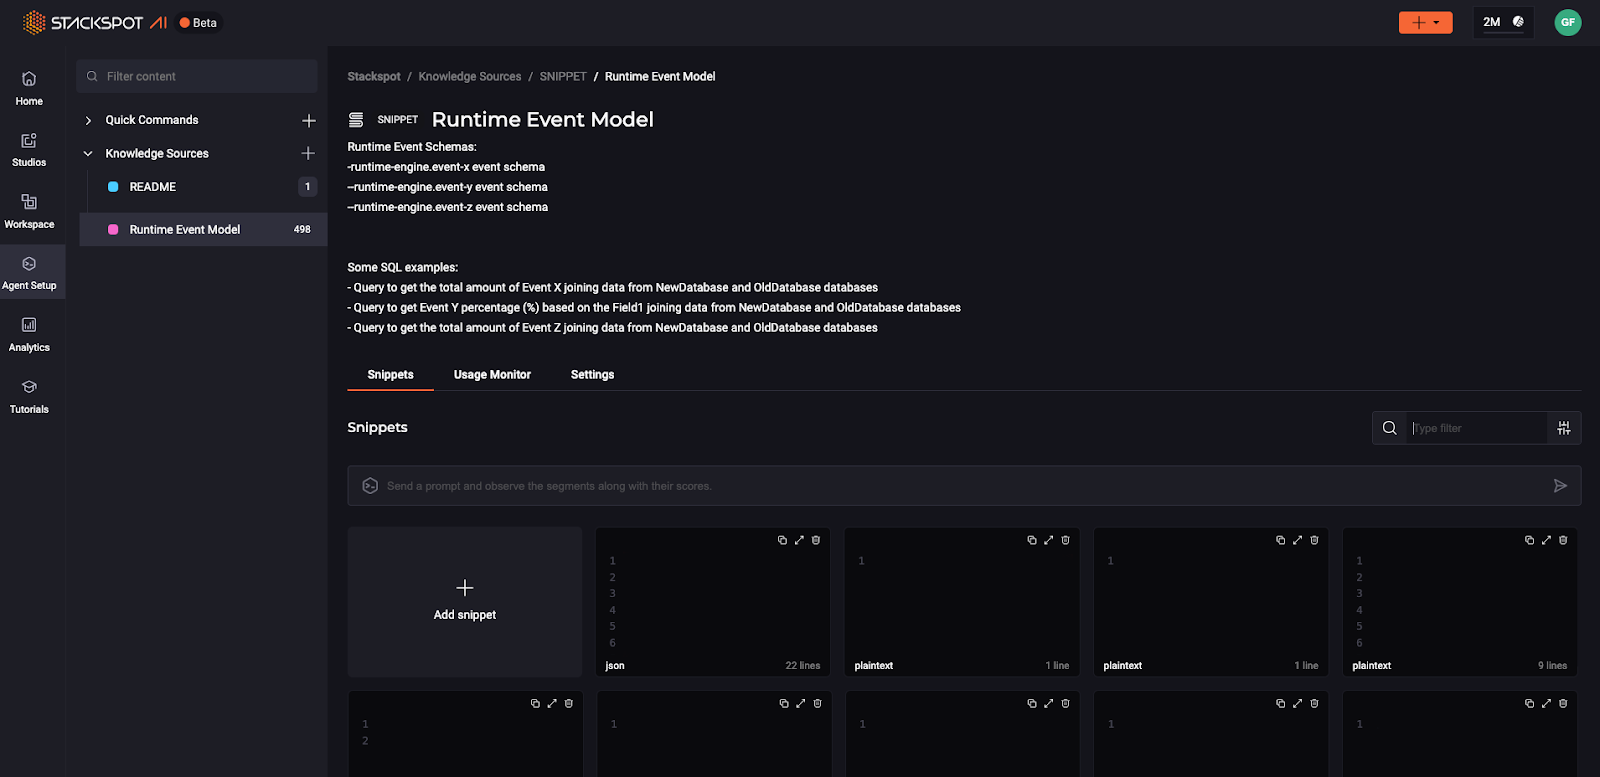
As StackSpot’s team uses StackSpot daily, we decided to use StackSpot AI to generate the expected SQL queries, using the concept of Knowledge Sources to take advantage of a hyper-contextualized AI agent.
The team added as Knowledge Sources the following data:
- Each data model for runtime engine v1 as JSON
- Each data model for runtime engine v2 as JSON
- SQL queries listing ten items of each data model from the OldDatabase as JSON
- SQL queries listing ten items of each data model from the NewDatabase as JSON
- Some Runtime Engine Business Rules as plain text
Based on those Knowledge Sources, we could ask the StackSpot AI prompt on VS Code (also available on IntelliJ) to generate some specific SQL queries to gather data the team needed.
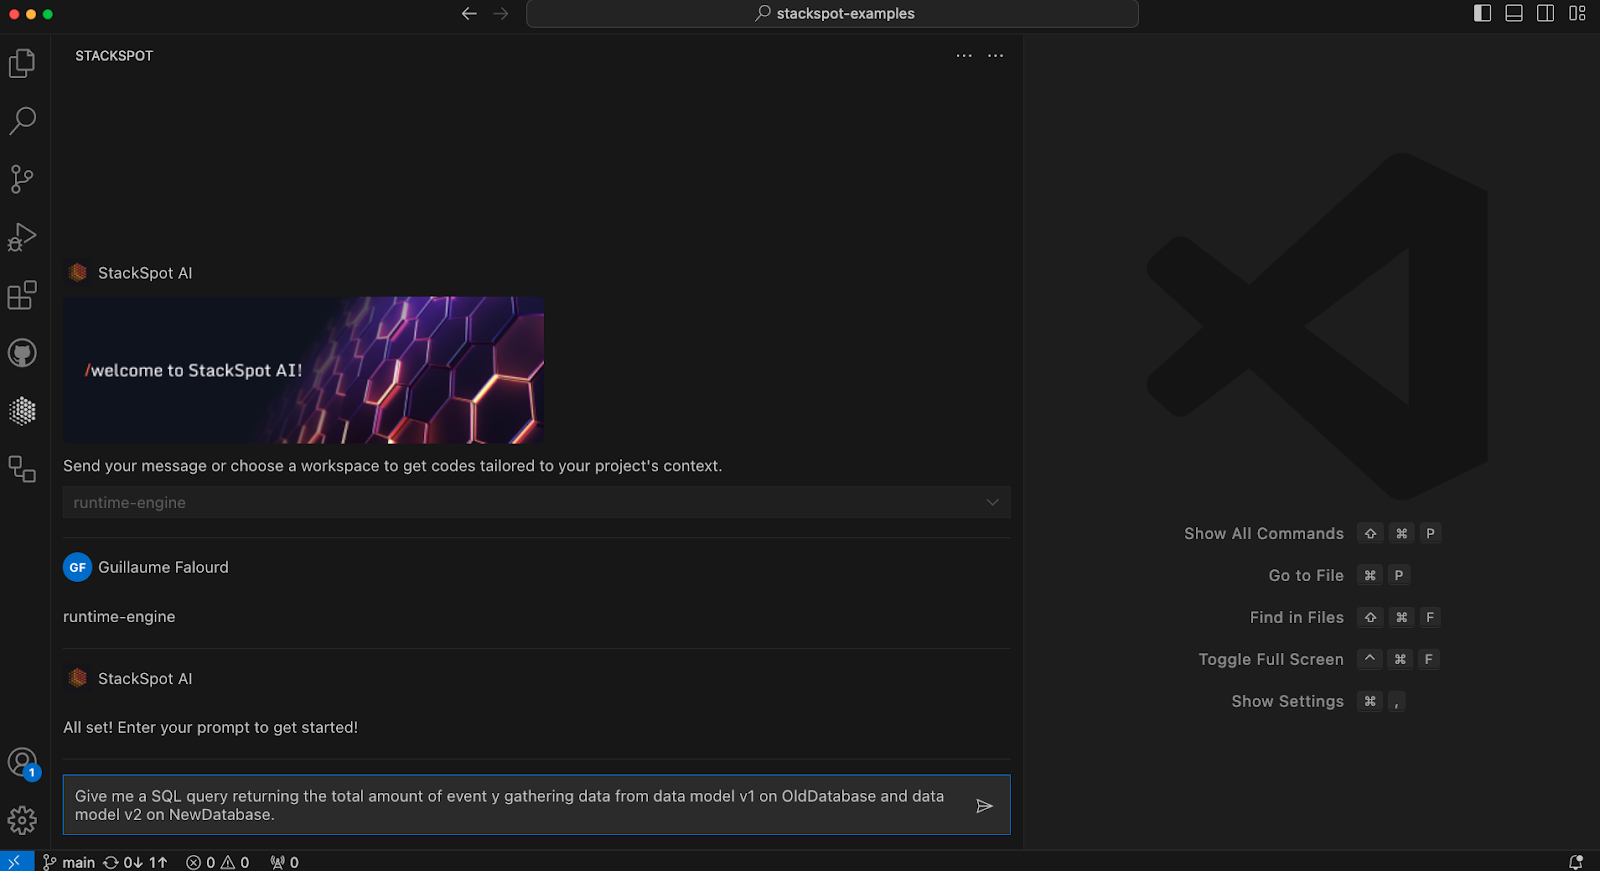
Example 1 (simple)
Give me a SQL query returning the total amount of events y gathering data from data model v1 on OldDatabase and data model v2 on NewDatabase.
The return was the following SQL query:
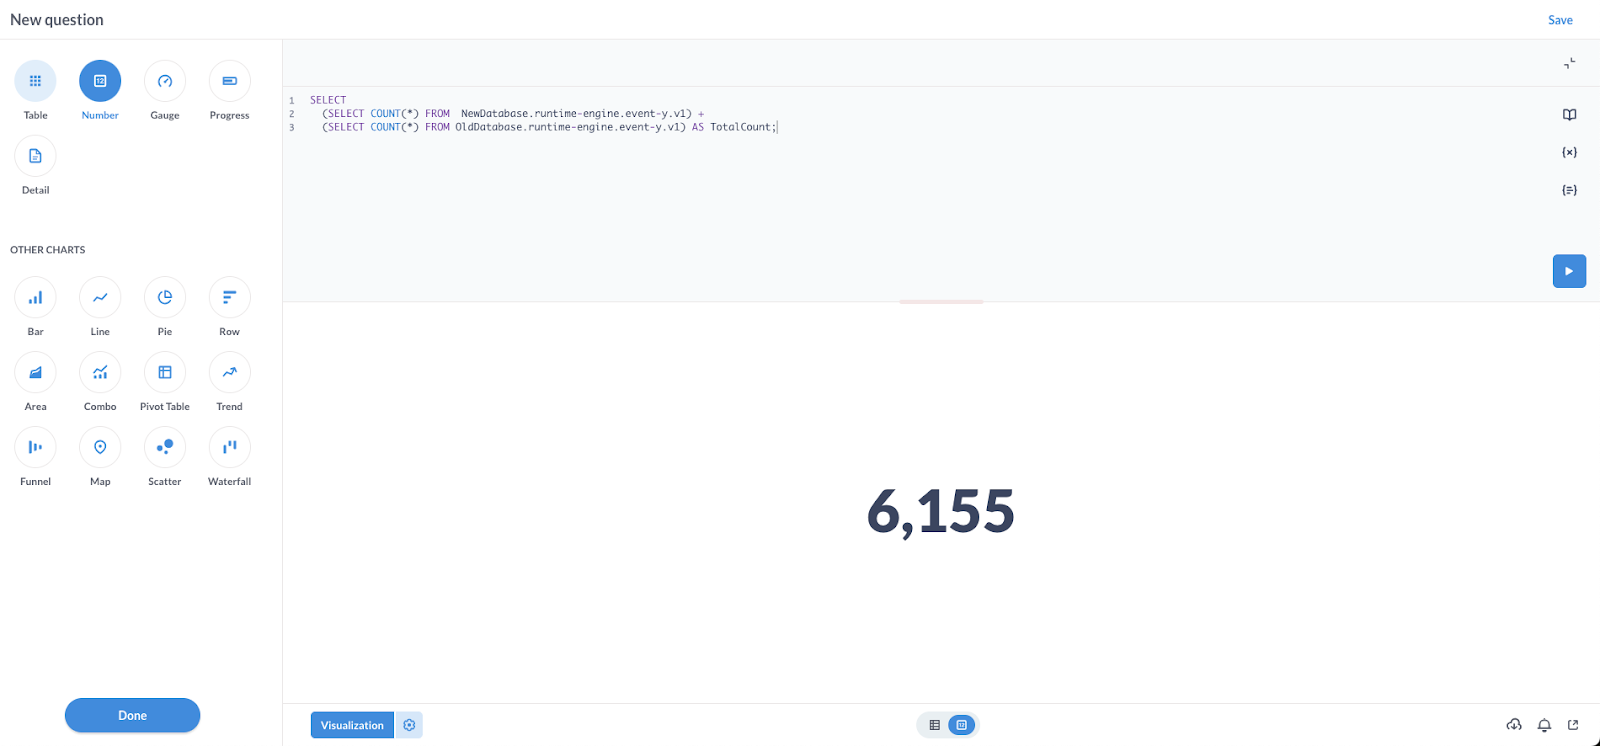
SELECT
  (SELECT COUNT(*) FROM  NewDatabase.runtime-engine.event-y.v1) +
  (SELECT COUNT(*) FROM OldDatabase.runtime-engine.event-y.v1) AS TotalCount;
Which, when used on the dashboard platform, returned: 6155
Example 2 (intermediate)
Give me a SQL query returning the amount of successful event X by status from OldDatabase and NewDatabase, considering that field1 value from data model v1 should be identical to field4 value from data model v2, ignoring VALUE1 and VALUE2.
The return was the following SQL query:
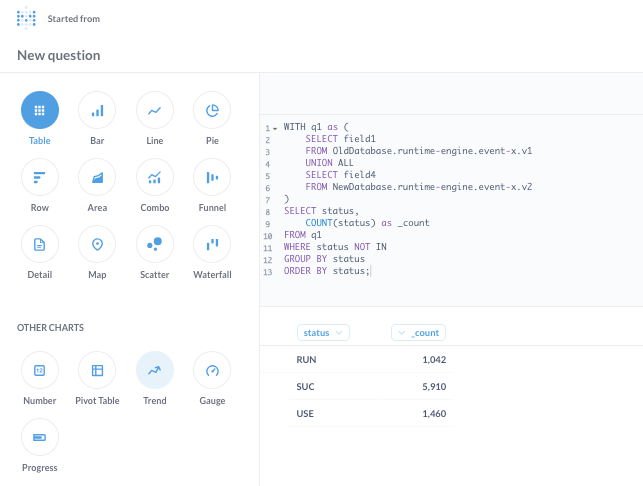
WITH q1 as (
    SELECT field1
    FROM OldDatabase.runtime-engine.event-x.v1
    UNION ALL
    SELECT field4
    FROM NewDatabase.runtime-engine.event-x.v2
)
SELECT status,
    COUNT(status) as _count
FROM q1
WHERE status NOT IN (VALUE1, VALUE2)
GROUP BY status
ORDER BY status;
Which, when used on the dashboard platform, returned as the next image shows:
Example 3 (complex)
Give me a SQL query returning the average duration of an event X between the moment it started and the moment it ended, segregated by status and gathering data from OldDatabase and NewDatabase, considering that field1 value from data model v1 is VALUE1 when started and can be VALUE2 or VALUE3 when ended (for the same field2 id value), and that field4 value from data model v2 is VALUE4 when started and can be VALUE5 or VALUE6 when ended (for the same field5 id value).
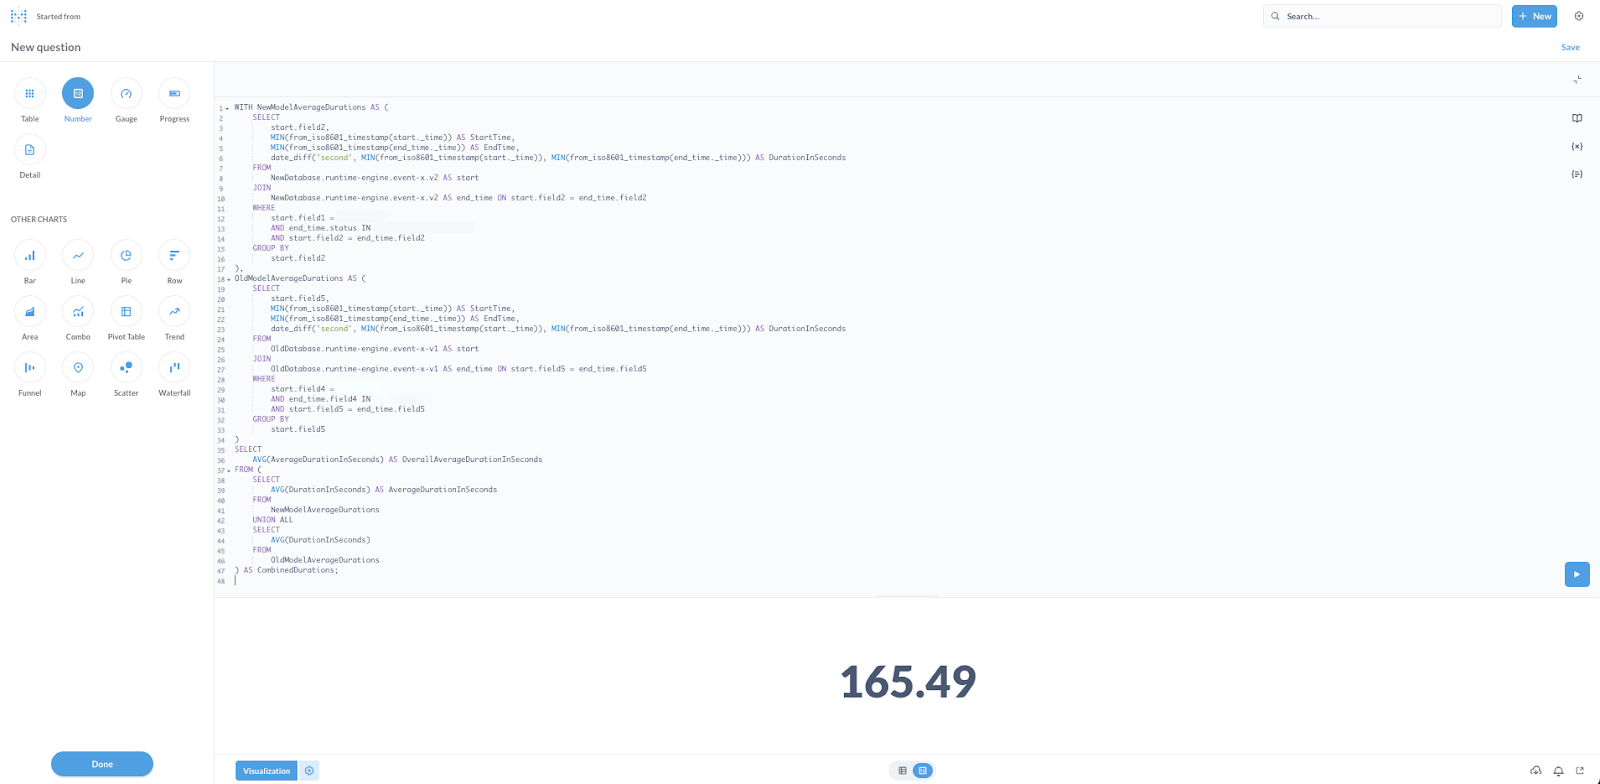
The return was the following SQL query
WITH NewModelAverageDurations AS (
    SELECT
        start.field2,
        MIN(from_iso8601_timestamp(start._time)) AS StartTime,
        MIN(from_iso8601_timestamp(end_time._time)) AS EndTime,
        date_diff('second', MIN(from_iso8601_timestamp(start._time)), MIN(from_iso8601_timestamp(end_time._time))) AS DurationInSeconds
    FROM
        NewDatabase.runtime-engine.event-x.v2 AS start
    JOIN
        NewDatabase.runtime-engine.event-x.v2 AS end_time ON start.field2 = end_time.field2
    WHERE
        start.field1 = 'VALUE1'
        AND end_time.status IN ('VALUE2', 'VALUE3')
        AND start.field2 = end_time.field2
    GROUP BY
        start.field2
),
OldModelAverageDurations AS (
    SELECT
        start.field5,
        MIN(from_iso8601_timestamp(start._time)) AS StartTime,
        MIN(from_iso8601_timestamp(end_time._time)) AS EndTime,
        date_diff('second', MIN(from_iso8601_timestamp(start._time)), MIN(from_iso8601_timestamp(end_time._time))) AS DurationInSeconds
    FROM
        OldDatabase.runtime-engine.event-x-v1 AS start
    JOIN
        OldDatabase.runtime-engine.event-x-v1 AS end_time ON start.field5 = end_time.field5
    WHERE
        start.field4 = 'RUNNING'
        AND end_time.field4 IN ('VALUE4', 'VALUE5')
        AND start.field5 = end_time.field5
    GROUP BY
        start.field5
)
SELECT
    AVG(AverageDurationInSeconds) AS OverallAverageDurationInSeconds
FROM (
    SELECT
        AVG(DurationInSeconds) AS AverageDurationInSeconds
    FROM
        NewModelAverageDurations
    UNION ALL
    SELECT
        AVG(DurationInSeconds)
    FROM
        OldModelAverageDurations
) AS CombinedDurations;
Which, when used on the dashboard platform, returned: 165.49s
Check out this video tutorial on our YouTube channel.
Conclusion
The Runtime Engine team successfully used artificial intelligence through StackSpot AI to write and optimize SQL queries automatically in seconds. It generated SQL on its unique data schema, making data more accessible for business users without needing Data engineers.
Note that even if some SQL queries weren’t returning the expected output firsthand, or even an SQL error, giving the feedback to the prompt allowed StackSpot AI to correct itself repeatedly.
While the team didn’t benefit from using it to get simple SQL queries, the benefits for complex queries were much higher regarding the time spent to build the queries according to the context and related to cognitive load.
Moreover, the team observed that the more we added knowledge sources, the more assertive the hyper-contextualized AI agent was in returning a correct SQL query, even based on the same prompt message.